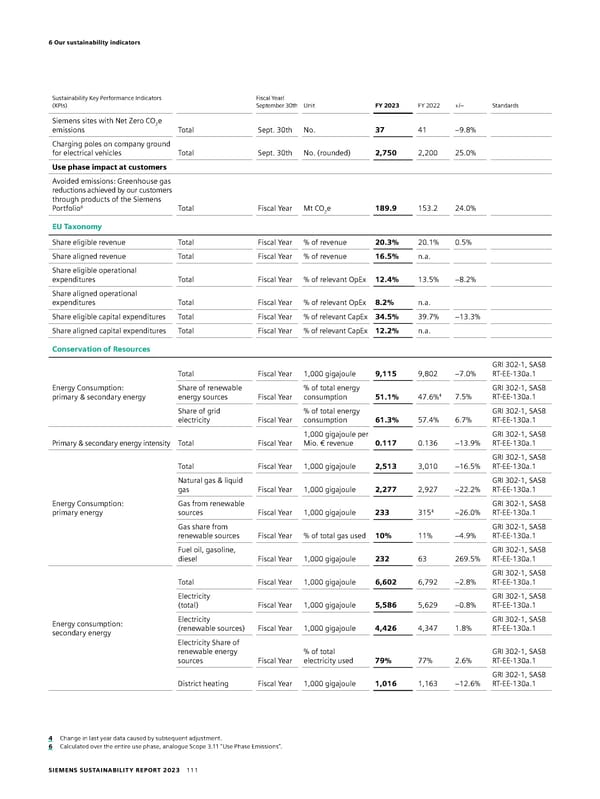
6 Our sustainability indicators Sustainability Key Performance Indicators Fiscal Year/ (KPIs) September 30th Unit FY 2023 FY 2022 +/– Standards Siemens sites with Net Zero CO e emissions 2 Total Sept. 30th No. 37 41 −9.8% Charging poles on company ground for electrical vehicles Total Sept. 30th No. (rounded) 2,750 2,200 25.0% Use phase impact at customers Avoided emissions: Greenhouse gas reductions achieved by our customers through products of the Siemens 6 Total Fiscal Year Mt CO e 189.9 153.2 24.0% Portfolio 2 EU Taxonomy Share eligible revenue Total Fiscal Year % of revenue 20.3% 20.1% 0.5% Share aligned revenue Total Fiscal Year % of revenue 16.5% n.a. Share eligible operational expenditures Total Fiscal Year % of relevant OpEx 12.4% 13.5% −8.2% Share aligned operational expenditures Total Fiscal Year % of relevant OpEx 8.2% n.a. Share eligible capital expenditures Total Fiscal Year % of relevant CapEx 34.5% 39.7% −13.3% Share aligned capital expenditures Total Fiscal Year % of relevant CapEx 12.2% n.a. Conservation of Resources GRI 302-1, SASB Total Fiscal Year 1,000 gigajoule 9,115 9,802 −7.0% RT-EE-130a.1 Energy Consumption: Share of renewable % of total energy GRI 302-1, SASB primary & secondary energy energy sources Fiscal Year consumption 51.1% 47.6%4 7.5% RT-EE-130a.1 Share of grid % of total energy GRI 302-1, SASB electricity Fiscal Year consumption 61.3% 57.4% 6.7% RT-EE-130a.1 1,000 gigajoule per GRI 302-1, SASB Primary & secondary energy intensity Total Fiscal Year Mio. € revenue 0.117 0.136 −13.9% RT-EE-130a.1 GRI 302-1, SASB Total Fiscal Year 1,000 gigajoule 2,513 3,010 −16.5% RT-EE-130a.1 Natural gas & liquid GRI 302-1, SASB gas Fiscal Year 1,000 gigajoule 2,277 2,927 −22.2% RT-EE-130a.1 Energy Consumption: Gas from renewable GRI 302-1, SASB primary energy sources Fiscal Year 1,000 gigajoule 233 3154 −26.0% RT-EE-130a.1 Gas share from GRI 302-1, SASB renewable sources Fiscal Year % of total gas used 10% 11% −4.9% RT-EE-130a.1 Fuel oil, gasoline, GRI 302-1, SASB diesel Fiscal Year 1,000 gigajoule 232 63 269.5% RT-EE-130a.1 GRI 302-1, SASB Total Fiscal Year 1,000 gigajoule 6,602 6,792 −2.8% RT-EE-130a.1 Electricity GRI 302-1, SASB (total) Fiscal Year 1,000 gigajoule 5,586 5,629 −0.8% RT-EE-130a.1 Energy consumption: Electricity GRI 302-1, SASB secondary energy (renewable sources) Fiscal Year 1,000 gigajoule 4,426 4,347 1.8% RT-EE-130a.1 Electricity Share of renewable energy % of total GRI 302-1, SASB sources Fiscal Year electricity used 79% 77% 2.6% RT-EE-130a.1 GRI 302-1, SASB District heating Fiscal Year 1,000 gigajoule 1,016 1,163 −12.6% RT-EE-130a.1 4 Change in last year data caused by subsequent adjustment. 6 Calculated over the entire use phase, analogue Scope 3.11 “Use Phase Emissions”. SIEMENS SUSTAINABILITY REPORT 2023 111
 Sustainability Report Page 110 Page 112