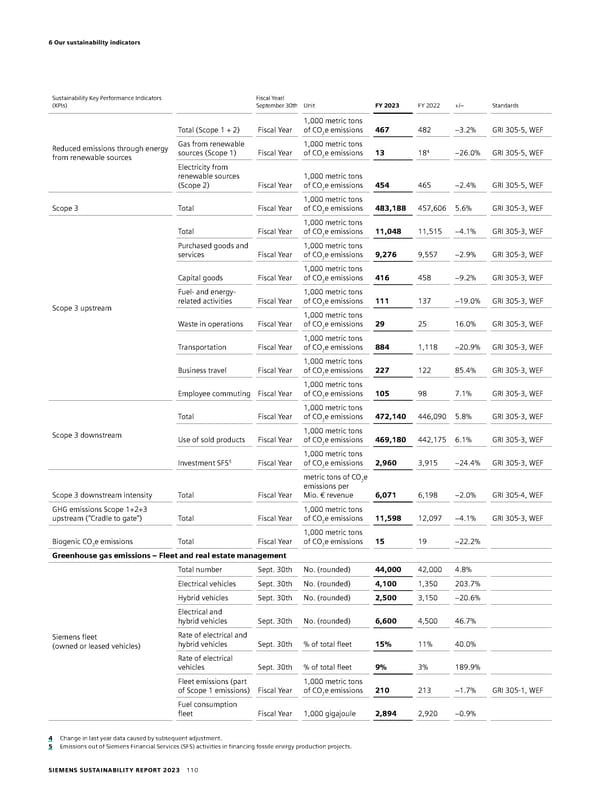
6 Our sustainability indicators Sustainability Key Performance Indicators Fiscal Year/ (KPIs) September 30th Unit FY 2023 FY 2022 +/– Standards 1,000 metric tons Total (Scope 1 + 2) Fiscal Year of CO e emissions 467 482 −3.2% GRI 305-5, WEF 2 Reduced emissions through energy Gas from renewable 1,000 metric tons sources (Scope 1) Fiscal Year of CO e emissions 13 184 −26.0% GRI 305-5, WEF from renewable sources 2 Electricity from renewable sources 1,000 metric tons (Scope 2) Fiscal Year of CO e emissions 454 465 −2.4% GRI 305-5, WEF 2 1,000 metric tons Scope 3 Total Fiscal Year of CO e emissions 483,188 457,606 5.6% GRI 305-3, WEF 2 1,000 metric tons Total Fiscal Year of CO e emissions 11,048 11,515 −4.1% GRI 305-3, WEF 2 Purchased goods and 1,000 metric tons services Fiscal Year of CO e emissions 9,276 9,557 −2.9% GRI 305-3, WEF 2 1,000 metric tons Capital goods Fiscal Year of CO e emissions 416 458 −9.2% GRI 305-3, WEF 2 Fuel- and energy- 1,000 metric tons related activities Fiscal Year of CO e emissions 111 137 −19.0% GRI 305-3, WEF Scope 3 upstream 2 1,000 metric tons Waste in operations Fiscal Year of CO e emissions 29 25 16.0% GRI 305-3, WEF 2 1,000 metric tons Transportation Fiscal Year of CO e emissions 884 1,118 −20.9% GRI 305-3, WEF 2 1,000 metric tons Business travel Fiscal Year of CO e emissions 227 122 85.4% GRI 305-3, WEF 2 1,000 metric tons Employee commuting Fiscal Year of CO e emissions 105 98 7.1% GRI 305-3, WEF 2 1,000 metric tons Total Fiscal Year of CO e emissions 472,140 446,090 5.8% GRI 305-3, WEF 2 Scope 3 downstream 1,000 metric tons Use of sold products Fiscal Year of CO e emissions 469,180 442,175 6.1% GRI 305-3, WEF 2 1,000 metric tons Investment SFS5 Fiscal Year of CO e emissions 2,960 3,915 −24.4% GRI 305-3, WEF 2 metric tons of CO2e emissions per Scope 3 downstream intensity Total Fiscal Year Mio. € revenue 6,071 6,198 −2.0% GRI 305-4, WEF GHG emissions Scope 1+2+3 1,000 metric tons upstream (“Cradle to gate”) Total Fiscal Year of CO e emissions 11,598 12,097 −4.1% GRI 305-3, WEF 2 1,000 metric tons Biogenic CO e emissions Total Fiscal Year of CO e emissions 15 19 −22.2% 2 2 Greenhouse gas emissions – Fleet and real estate management Total number Sept. 30th No. (rounded) 44,000 42,000 4.8% Electrical vehicles Sept. 30th No. (rounded) 4,100 1,350 203.7% Hybrid vehicles Sept. 30th No. (rounded) 2,500 3,150 −20.6% Electrical and hybrid vehicles Sept. 30th No. (rounded) 6,600 4,500 46.7% Siemens fleet Rate of electrical and (owned or leased vehicles) hybrid vehicles Sept. 30th % of total fleet 15% 11% 40.0% Rate of electrical vehicles Sept. 30th % of total fleet 9% 3% 189.9% Fleet emissions (part 1,000 metric tons of Scope 1 emissions) Fiscal Year of CO e emissions 210 213 −1.7% GRI 305-1, WEF 2 Fuel consumption fleet Fiscal Year 1,000 gigajoule 2,894 2,920 −0.9% 4 Change in last year data caused by subsequent adjustment. 5 Emissions out of Siemens Financial Services (SFS) activities in financing fossile energy production projects. SIEMENS SUSTAINABILITY REPORT 2023 110
 Sustainability Report Page 109 Page 111