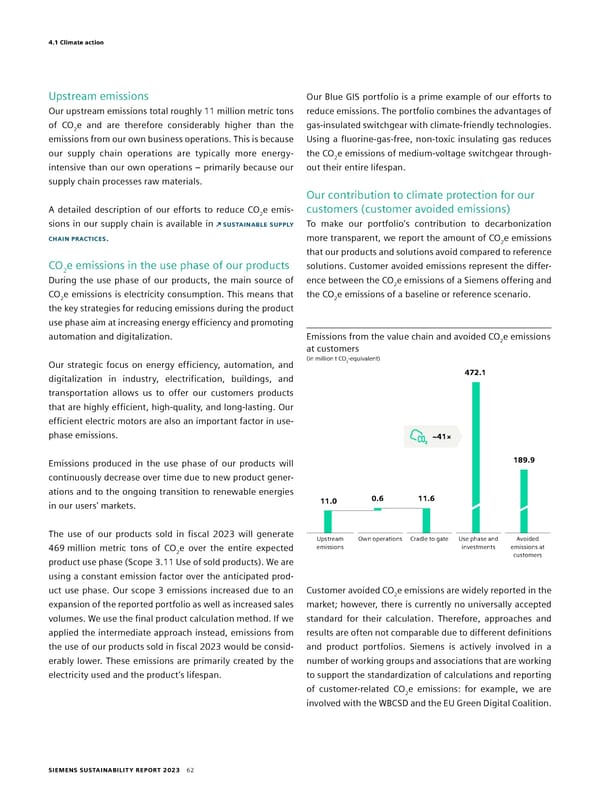
4.1 Climate action Upstream emissions Our Blue GIS portfolio is a prime example of our efforts to Our upstream emissions total roughly 11 million metric tons reduce emissions. The portfolio combines the advantages of of CO e and are therefore considerably higher than the gas-insulated switchgear with climate-friendly technologies. 2 emissions from our own business operations. This is because Using a fluorine-gas-free, non-toxic insulating gas reduces our supply chain operations are typically more energy- the CO e emissions of medium-voltage switchgear through- 2 intensive than our own operations – primarily because our out their entire lifespan. supply chain processes raw materials. Our contribution to climate protection for our A detailed description of our efforts to reduce CO e emis- customers (customer avoided emissions) 2 sions in our supply chain is available in SUSTAINABLE SUPPLY To make our portfolio’s contribution to decarbonization CHAIN PRACTICES. more transparent, we report the amount of CO e emissions 2 that our products and solutions avoid compared to reference CO2e emissions in the use phase of our products solutions. Customer avoided emissions represent the differ- During the use phase of our products, the main source of ence between the CO e emissions of a Siemens offering and 2 CO e emissions is electricity consumption. This means that the CO e emissions of a baseline or reference scenario. 2 2 the key strategies for reducing emissions during the product use phase aim at increasing energy efficiency and promoting automation and digitalization. Emissions from the value chain and avoided CO e emissions at customers 2 (in million t CO -equivalent) Our strategic focus on energy efficiency, automation, and 2 digitalization in industry, electrification, buildings, and 472.1 transportation allows us to offer our customers products that are highly efficient, high-quality, and long-lasting. Our efficient electric motors are also an important factor in use- phase emissions. ~41× Emissions produced in the use phase of our products will 189.9 continuously decrease over time due to new product gener- ations and to the ongoing transition to renewable energies 0.6 11.6 in our users’ markets. 11.0 The use of our products sold in fiscal 2023 will generate Upstream Own operations Cradle to gate Use phase and Avoided 469 million metric tons of CO e over the entire expected emissions investments emissions at 2 customers product use phase (Scope 3.11 Use of sold products). We are using a constant emission factor over the anticipated prod- uct use phase. Our scope 3 emissions increased due to an Customer avoided CO e emissions are widely reported in the 2 expansion of the reported portfolio as well as increased sales market; however, there is currently no universally accepted volumes. We use the final product calculation method. If we standard for their calculation. Therefore, approaches and applied the intermediate approach instead, emissions from results are often not comparable due to different definitions the use of our products sold in fiscal 2023 would be consid- and product portfolios. Siemens is actively involved in a erably lower. These emissions are primarily created by the number of working groups and associations that are working electricity used and the product’s lifespan. to support the standardization of calculations and reporting of customer-related CO2e emissions: for example, we are involved with the WBCSD and the EU Green Digital Coalition. SIEMENS SUSTAINABILITY REPORT 2023 62
 Sustainability Report Page 61 Page 63