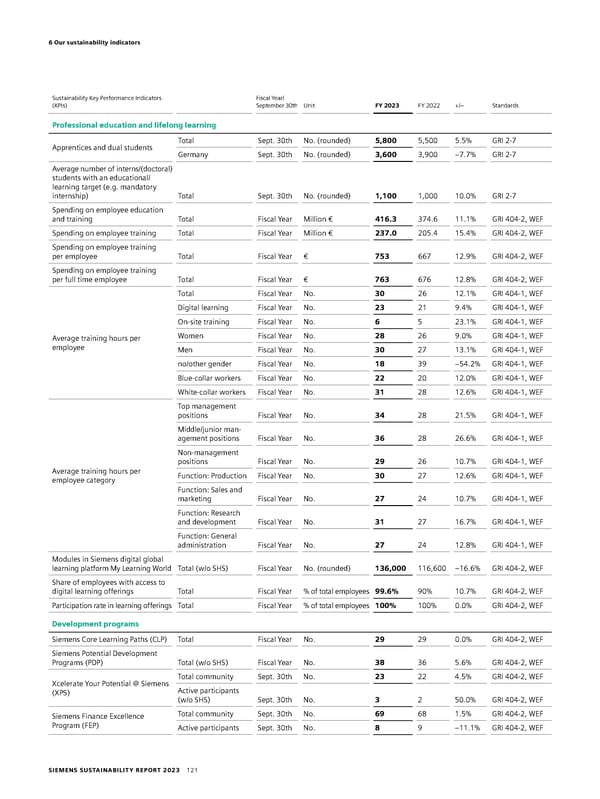
6 Our sustainability indicators Sustainability Key Performance Indicators Fiscal Year/ (KPIs) September 30th Unit FY 2023 FY 2022 +/– Standards Professional education and lifelong learning Apprentices and dual students Total Sept. 30th No. (rounded) 5,800 5,500 5.5% GRI 2-7 Germany Sept. 30th No. (rounded) 3,600 3,900 −7.7% GRI 2-7 Average number of interns/(doctoral) students with an educational/ learning target (e.g. mandatory internship) Total Sept. 30th No. (rounded) 1,100 1,000 10.0% GRI 2-7 Spending on employee education and training Total Fiscal Year Million € 416.3 374.6 11.1% GRI 404-2, WEF Spending on employee training Total Fiscal Year Million € 237.0 205.4 15.4% GRI 404-2, WEF Spending on employee training per employee Total Fiscal Year € 753 667 12.9% GRI 404-2, WEF Spending on employee training per full time employee Total Fiscal Year € 763 676 12.8% GRI 404-2, WEF Total Fiscal Year No. 30 26 12.1% GRI 404-1, WEF Digital learning Fiscal Year No. 23 21 9.4% GRI 404-1, WEF On-site training Fiscal Year No. 6 5 23.1% GRI 404-1, WEF Average training hours per Women Fiscal Year No. 28 26 9.0% GRI 404-1, WEF employee Men Fiscal Year No. 30 27 13.1% GRI 404-1, WEF no/other gender Fiscal Year No. 18 39 −54.2% GRI 404-1, WEF Blue-collar workers Fiscal Year No. 22 20 12.0% GRI 404-1, WEF White-collar workers Fiscal Year No. 31 28 12.6% GRI 404-1, WEF Top management positions Fiscal Year No. 34 28 21.5% GRI 404-1, WEF Middle/junior man- agement positions Fiscal Year No. 36 28 26.6% GRI 404-1, WEF Non-management positions Fiscal Year No. 29 26 10.7% GRI 404-1, WEF Average training hours per Function: Production Fiscal Year No. 30 27 12.6% GRI 404-1, WEF employee category Function: Sales and marketing Fiscal Year No. 27 24 10.7% GRI 404-1, WEF Function: Research and development Fiscal Year No. 31 27 16.7% GRI 404-1, WEF Function: General administration Fiscal Year No. 27 24 12.8% GRI 404-1, WEF Modules in Siemens digital global learning platform My Learning World Total (w/o SHS) Fiscal Year No. (rounded) 136,000 116,600 –16.6% GRI 404-2, WEF Share of employees with access to digital learning offerings Total Fiscal Year % of total employees 99.6% 90% 10.7% GRI 404-2, WEF Participation rate in learning offerings Total Fiscal Year % of total employees 100% 100% 0.0% GRI 404-2, WEF Development programs Siemens Core Learning Paths (CLP) Total Fiscal Year No. 29 29 0.0% GRI 404-2, WEF Siemens Potential Development Programs (PDP) Total (w/o SHS) Fiscal Year No. 38 36 5.6% GRI 404-2, WEF Xcelerate Your Potential @ Siemens Total community Sept. 30th No. 23 22 4.5% GRI 404-2, WEF (XPS) Active participants (w/o SHS) Sept. 30th No. 3 2 50.0% GRI 404-2, WEF Siemens Finance Excellence Total community Sept. 30th No. 69 68 1.5% GRI 404-2, WEF Program (FEP) Active participants Sept. 30th No. 8 9 –11.1% GRI 404-2, WEF SIEMENS SUSTAINABILITY REPORT 2023 121
 Sustainability Report Page 120 Page 122