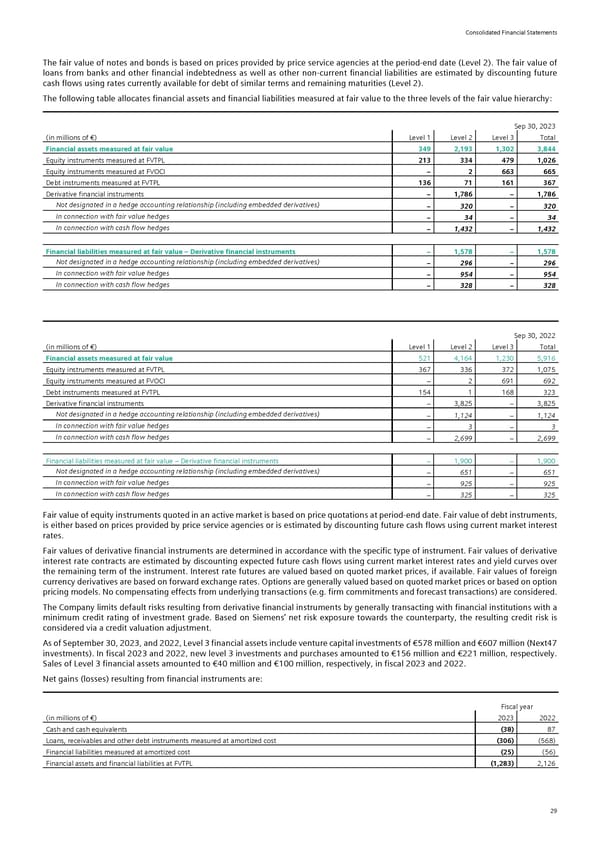
Consolidated Financial Statements The fair value of notes and bonds is based on prices provided by price service agencies at the period-end date (Level 2). The fair value of loans from banks and other financial indebtedness as well as other non-current financial liabilities are estimated by discounting future cash flows using rates currently available for debt of similar terms and remaining maturities (Level 2). The following table allocates financial assets and financial liabilities measured at fair value to the three levels of the fair value hierarchy: Sep 30, 2023 (in millions of €) Level 1 Level 2 Level 3 Total Financial assets measured at fair value 349 2,193 1,302 3,844 Equity instruments measured at FVTPL 213 334 479 1,026 Equity instruments measured at FVOCI − 2 663 665 Debt instruments measured at FVTPL 136 71 161 367 Derivative financial instruments − 1,786 − 1,786 Not designated in a hedge accounting relationship (including embedded derivatives) − 320 − 320 In connection with fair value hedges − 34 − 34 In connection with cash flow hedges − 1,432 − 1,432 Financial liabilities measured at fair value – Derivative financial instruments − 1,578 − 1,578 Not designated in a hedge accounting relationship (including embedded derivatives) − 296 − 296 In connection with fair value hedges − 954 − 954 In connection with cash flow hedges − 328 − 328 Sep 30, 2022 (in millions of €) Level 1 Level 2 Level 3 Total Financial assets measured at fair value 521 4,164 1,230 5,916 Equity instruments measured at FVTPL 367 336 372 1,075 Equity instruments measured at FVOCI > 2 691 692 Debt instruments measured at FVTPL 154 1 168 323 Derivative financial instruments > 3,825 > 3,825 Not designated in a hedge accounting relationship (including embedded derivatives) − 1,124 − 1,124 In connection with fair value hedges − 3 − 3 In connection with cash flow hedges − 2,699 − 2,699 Financial liabilities measured at fair value – Derivative financial instruments > 1,900 > 1,900 Not designated in a hedge accounting relationship (including embedded derivatives) − 651 − 651 In connection with fair value hedges − 925 − 925 In connection with cash flow hedges − 325 − 325 Fair value of equity instruments quoted in an active market is based on price quotations at period-end date. Fair value of debt instruments, is either based on prices provided by price service agencies or is estimated by discounting future cash flows using current market interest rates. Fair values of derivative financial instruments are determined in accordance with the specific type of instrument. Fair values of derivative interest rate contracts are estimated by discounting expected future cash flows using current market interest rates and yield curves over the remaining term of the instrument. Interest rate futures are valued based on quoted market prices, if available. Fair values of foreign currency derivatives are based on forward exchange rates. Options are generally valued based on quoted market prices or based on option pricing models. No compensating effects from underlying transactions (e.g. firm commitments and forecast transactions) are considered. The Company limits default risks resulting from derivative financial instruments by generally transacting with financial institutions with a minimum credit rating of investment grade. Based on Siemens’ net risk exposure towards the counterparty, the resulting credit risk is considered via a credit valuation adjustment. As of September 30, 2023, and 2022, Level 3 financial assets include venture capital investments of €578 million and €607 million (Next47 investments). In fiscal 2023 and 2022, new level 3 investments and purchases amounted to €156 million and €221 million, respectively. Sales of Level 3 financial assets amounted to €40 million and €100 million, respectively, in fiscal 2023 and 2022. Net gains (losses) resulting from financial instruments are: Fiscal year (in millions of €) 2023 2022 Cash and cash equivalents (38) 87 Loans, receivables and other debt instruments measured at amortized cost (306) (568) Financial liabilities measured at amortized cost (25) (56) Financial assets and financial liabilities at FVTPL (1,283) 2,126 29
 Siemens Report FY2023 Page 74 Page 76