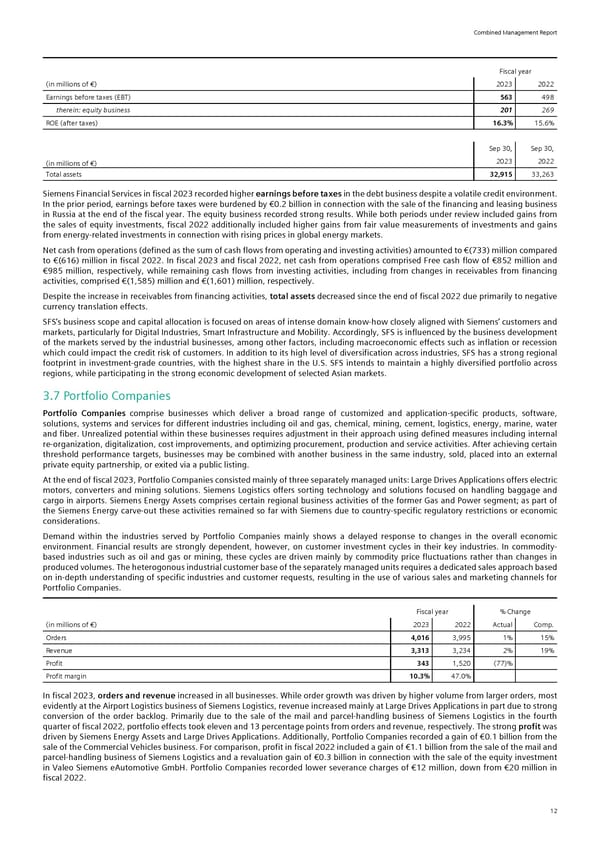
Combined Management Report Fiscal year (in millions of €) 2023 2022 Earnings before taxes (EBT) 563 498 therein: equity business 201 269 ROE (after taxes) 16.3% 15.6% Sep 30, Sep 30, (in millions of €) 2023 2022 Total assets 32,915 33,263 Siemens Financial Services in fiscal 2023 recorded higher earnings before taxes in the debt business despite a volatile credit environment. In the prior period, earnings before taxes were burdened by €0.2 billion in connection with the sale of the financing and leasing business in Russia at the end of the fiscal year. The equity business recorded strong results. While both periods under review included gains from the sales of equity investments, fiscal 2022 additionally included higher gains from fair value measurements of investments and gains from energy-related investments in connection with rising prices in global energy markets. Net cash from operations (defined as the sum of cash flows from operating and investing activities) amounted to €(733) million compared to €(616) million in fiscal 2022. In fiscal 2023 and fiscal 2022, net cash from operations comprised Free cash flow of €852 million and €985 million, respectively, while remaining cash flows from investing activities, including from changes in receivables from financing activities, comprised €(1,585) million and €(1,601) million, respectively. Despite the increase in receivables from financing activities, total assets decreased since the end of fiscal 2022 due primarily to negative currency translation effects. SFS’s business scope and capital allocation is focused on areas of intense domain know-how closely aligned with Siemens’ customers and markets, particularly for Digital Industries, Smart Infrastructure and Mobility. Accordingly, SFS is influenced by the business development of the markets served by the industrial businesses, among other factors, including macroeconomic effects such as inflation or recession which could impact the credit risk of customers. In addition to its high level of diversification across industries, SFS has a strong regional footprint in investment-grade countries, with the highest share in the U.S. SFS intends to maintain a highly diversified portfolio across regions, while participating in the strong economic development of selected Asian markets. 3.7 Portfolio Companies Portfolio Companies comprise businesses which deliver a broad range of customized and application-specific products, software, solutions, systems and services for different industries including oil and gas, chemical, mining, cement, logistics, energy, marine, water and fiber. Unrealized potential within these businesses requires adjustment in their approach using defined measures including internal re-organization, digitalization, cost improvements, and optimizing procurement, production and service activities. After achieving certain threshold performance targets, businesses may be combined with another business in the same industry, sold, placed into an external private equity partnership, or exited via a public listing. At the end of fiscal 2023, Portfolio Companies consisted mainly of three separately managed units: Large Drives Applications offers electric motors, converters and mining solutions. Siemens Logistics offers sorting technology and solutions focused on handling baggage and cargo in airports. Siemens Energy Assets comprises certain regional business activities of the former Gas and Power segment; as part of the Siemens Energy carve-out these activities remained so far with Siemens due to country-specific regulatory restrictions or economic considerations. Demand within the industries served by Portfolio Companies mainly shows a delayed response to changes in the overall economic environment. Financial results are strongly dependent, however, on customer investment cycles in their key industries. In commodity- based industries such as oil and gas or mining, these cycles are driven mainly by commodity price fluctuations rather than changes in produced volumes. The heterogonous industrial customer base of the separately managed units requires a dedicated sales approach based on in-depth understanding of specific industries and customer requests, resulting in the use of various sales and marketing channels for Portfolio Companies. Fiscal year % Change (in millions of €) 2023 2022 Actual Comp. Orders 4,016 3,995 1% 15% Revenue 3,313 3,234 2% 19% Profit 343 1,520 (77)% Profit margin 10.3% 47.0% In fiscal 2023, orders and revenue increased in all businesses. While order growth was driven by higher volume from larger orders, most evidently at the Airport Logistics business of Siemens Logistics, revenue increased mainly at Large Drives Applications in part due to strong conversion of the order backlog. Primarily due to the sale of the mail and parcel-handling business of Siemens Logistics in the fourth quarter of fiscal 2022, portfolio effects took eleven and 13 percentage points from orders and revenue, respectively. The strong profit was driven by Siemens Energy Assets and Large Drives Applications. Additionally, Portfolio Companies recorded a gain of €0.1 billion from the sale of the Commercial Vehicles business. For comparison, profit in fiscal 2022 included a gain of €1.1 billion from the sale of the mail and parcel-handling business of Siemens Logistics and a revaluation gain of €0.3 billion in connection with the sale of the equity investment in Valeo Siemens eAutomotive GmbH. Portfolio Companies recorded lower severance charges of €12 million, down from €20 million in fiscal 2022. 12
 Siemens Report FY2023 Page 13 Page 15