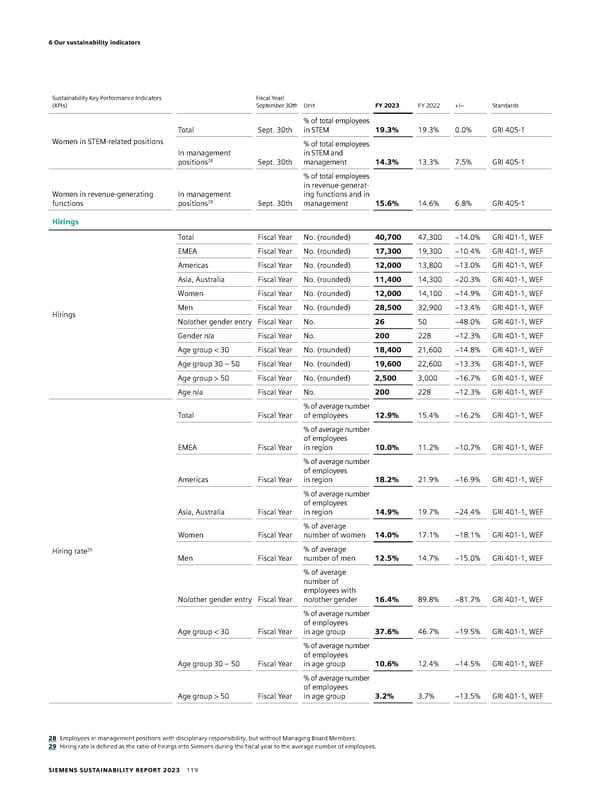
6 Our sustainability indicators Sustainability Key Performance Indicators Fiscal Year/ (KPIs) September 30th Unit FY 2023 FY 2022 +/– Standards % of total employees Total Sept. 30th in STEM 19.3% 19.3% 0.0% GRI 405-1 Women in STEM-related positions % of total employees In management in STEM and positions28 Sept. 30th management 14.3% 13.3% 7.5% GRI 405-1 % of total employees in revenue-generat- Women in revenue-generating In management ing functions and in functions positions28 Sept. 30th management 15.6% 14.6% 6.8% GRI 405-1 Hirings Total Fiscal Year No. (rounded) 40,700 47,300 −14.0% GRI 401-1, WEF EMEA Fiscal Year No. (rounded) 17,300 19,300 −10.4% GRI 401-1, WEF Americas Fiscal Year No. (rounded) 12,000 13,800 −13.0% GRI 401-1, WEF Asia, Australia Fiscal Year No. (rounded) 11,400 14,300 −20.3% GRI 401-1, WEF Women Fiscal Year No. (rounded) 12,000 14,100 −14.9% GRI 401-1, WEF Hirings Men Fiscal Year No. (rounded) 28,500 32,900 −13.4% GRI 401-1, WEF No/other gender entry Fiscal Year No. 26 50 −48.0% GRI 401-1, WEF Gender n/a Fiscal Year No. 200 228 –12.3% GRI 401-1, WEF Age group < 30 Fiscal Year No. (rounded) 18,400 21,600 −14.8% GRI 401-1, WEF Age group 30 – 50 Fiscal Year No. (rounded) 19,600 22,600 –13.3% GRI 401-1, WEF Age group > 50 Fiscal Year No. (rounded) 2,500 3,000 −16.7% GRI 401-1, WEF Age n/a Fiscal Year No. 200 228 −12.3% GRI 401-1, WEF % of average number Total Fiscal Year of employees 12.9% 15.4% −16.2% GRI 401-1, WEF % of average number of employees EMEA Fiscal Year in region 10.0% 11.2% −10.7% GRI 401-1, WEF % of average number of employees Americas Fiscal Year in region 18.2% 21.9% −16.9% GRI 401-1, WEF % of average number of employees Asia, Australia Fiscal Year in region 14.9% 19.7% −24.4% GRI 401-1, WEF % of average Women Fiscal Year number of women 14.0% 17.1% −18.1% GRI 401-1, WEF Hiring rate29 % of average Men Fiscal Year number of men 12.5% 14.7% −15.0% GRI 401-1, WEF % of average number of employees with No/other gender entry Fiscal Year no/other gender 16.4% 89.8% −81.7% GRI 401-1, WEF % of average number of employees Age group < 30 Fiscal Year in age group 37.6% 46.7% −19.5% GRI 401-1, WEF % of average number of employees Age group 30 – 50 Fiscal Year in age group 10.6% 12.4% −14.5% GRI 401-1, WEF % of average number of employees Age group > 50 Fiscal Year in age group 3.2% 3.7% −13.5% GRI 401-1, WEF 28 Employees in management positions with disciplinary responsibility, but without Managing Board Members. 29 Hiring rate is defined as the ratio of hirings into Siemens during the fiscal year to the average number of employees. SIEMENS SUSTAINABILITY REPORT 2023 119
 Sustainability Report Page 118 Page 120