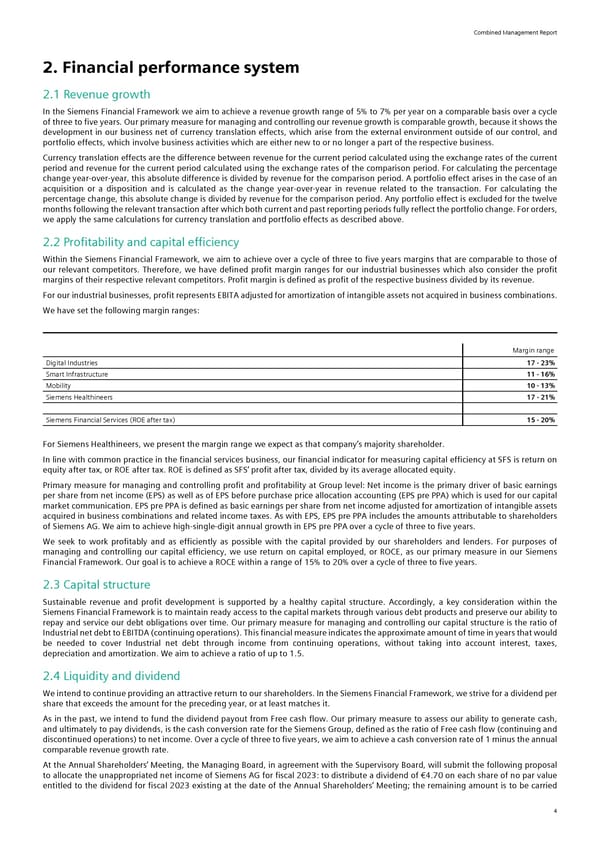
Combined Management Report 2. Financial performance system 2.1 Revenue growth In the Siemens Financial Framework we aim to achieve a revenue growth range of 5% to 7% per year on a comparable basis over a cycle of three to five years. Our primary measure for managing and controlling our revenue growth is comparable growth, because it shows the development in our business net of currency translation effects, which arise from the external environment outside of our control, and portfolio effects, which involve business activities which are either new to or no longer a part of the respective business. Currency translation effects are the difference between revenue for the current period calculated using the exchange rates of the current period and revenue for the current period calculated using the exchange rates of the comparison period. For calculating the percentage change year-over-year, this absolute difference is divided by revenue for the comparison period. A portfolio effect arises in the case of an acquisition or a disposition and is calculated as the change year-over-year in revenue related to the transaction. For calculating the percentage change, this absolute change is divided by revenue for the comparison period. Any portfolio effect is excluded for the twelve months following the relevant transaction after which both current and past reporting periods fully reflect the portfolio change. For orders, we apply the same calculations for currency translation and portfolio effects as described above. 2.2 Profitability and capital efficiency Within the Siemens Financial Framework, we aim to achieve over a cycle of three to five years margins that are comparable to those of our relevant competitors. Therefore, we have defined profit margin ranges for our industrial businesses which also consider the profit margins of their respective relevant competitors. Profit margin is defined as profit of the respective business divided by its revenue. For our industrial businesses, profit represents EBITA adjusted for amortization of intangible assets not acquired in business combinations. We have set the following margin ranges: Margin range Digital Industries 17 - 23% Smart Infrastructure 11 - 16% Mobility 10 - 13% Siemens Healthineers 17 - 21% Siemens Financial Services (ROE after tax) 15 - 20% For Siemens Healthineers, we present the margin range we expect as that company’s majority shareholder. In line with common practice in the financial services business, our financial indicator for measuring capital efficiency at SFS is return on equity after tax, or ROE after tax. ROE is defined as SFS’ profit after tax, divided by its average allocated equity. Primary measure for managing and controlling profit and profitability at Group level: Net income is the primary driver of basic earnings per share from net income (EPS) as well as of EPS before purchase price allocation accounting (EPS pre PPA) which is used for our capital market communication. EPS pre PPA is defined as basic earnings per share from net income adjusted for amortization of intangible assets acquired in business combinations and related income taxes. As with EPS, EPS pre PPA includes the amounts attributable to shareholders of Siemens AG. We aim to achieve high-single-digit annual growth in EPS pre PPA over a cycle of three to five years. We seek to work profitably and as efficiently as possible with the capital provided by our shareholders and lenders. For purposes of managing and controlling our capital efficiency, we use return on capital employed, or ROCE, as our primary measure in our Siemens Financial Framework. Our goal is to achieve a ROCE within a range of 15% to 20% over a cycle of three to five years. 2.3 Capital structure Sustainable revenue and profit development is supported by a healthy capital structure. Accordingly, a key consideration within the Siemens Financial Framework is to maintain ready access to the capital markets through various debt products and preserve our ability to repay and service our debt obligations over time. Our primary measure for managing and controlling our capital structure is the ratio of Industrial net debt to EBITDA (continuing operations). This financial measure indicates the approximate amount of time in years that would be needed to cover Industrial net debt through income from continuing operations, without taking into account interest, taxes, depreciation and amortization. We aim to achieve a ratio of up to 1.5. 2.4 Liquidity and dividend We intend to continue providing an attractive return to our shareholders. In the Siemens Financial Framework, we strive for a dividend per share that exceeds the amount for the preceding year, or at least matches it. As in the past, we intend to fund the dividend payout from Free cash flow. Our primary measure to assess our ability to generate cash, and ultimately to pay dividends, is the cash conversion rate for the Siemens Group, defined as the ratio of Free cash flow (continuing and discontinued operations) to net income. Over a cycle of three to five years, we aim to achieve a cash conversion rate of 1 minus the annual comparable revenue growth rate. At the Annual Shareholders’ Meeting, the Managing Board, in agreement with the Supervisory Board, will submit the following proposal to allocate the unappropriated net income of Siemens AG for fiscal 2023: to distribute a dividend of €4.70 on each share of no par value entitled to the dividend for fiscal 2023 existing at the date of the Annual Shareholders’ Meeting; the remaining amount is to be carried 4
 Siemens Report FY2023 Page 5 Page 7