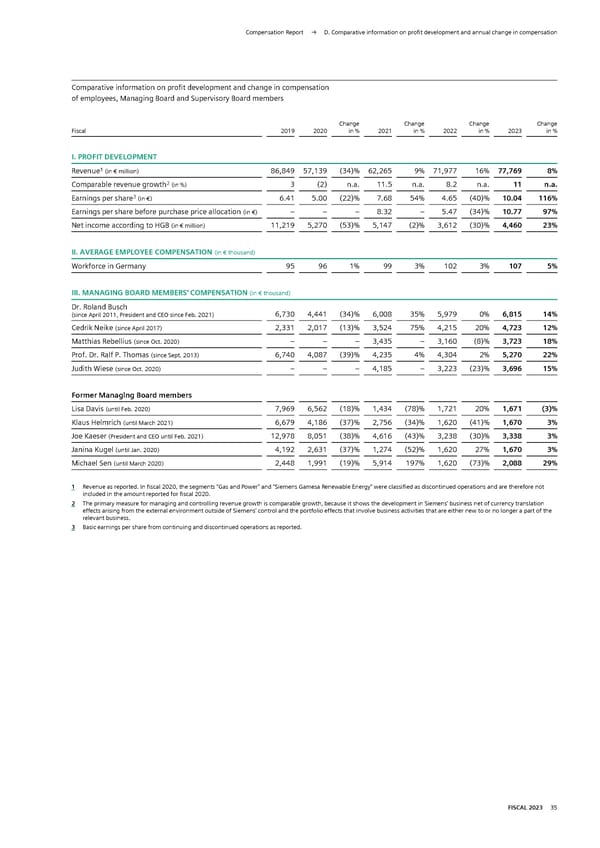
Compensation Report → D. Comparative information on profit development and annual change in compensation Comparative information on profit development and change in compensation of employees, Managing Board and Supervisory Board members Change Change Change Change Fiscal 2019 2020 in % 2021 in % 2022 in % 2023 in % I. PROFIT DEVELOPMENT 1 Revenue (in € million) 86,849 57,139 (34)% 62,265 9% 71,977 16% 77,769 8% 2 Comparable revenue growth (in %) 3 (2) n.a. 11.5 n.a. 8.2 n.a. 11 n.a. 3 Earnings per share (in €) 6.41 5.00 (22)% 7.68 54% 4.65 (40)% 10.04 116% Earnings per share before purchase price allocation (in €) – – – 8.32 – 5.47 (34)% 10.77 97% Net income according to HGB (in € million) 11,219 5,270 (53)% 5,147 (2)% 3,612 (30)% 4,460 23% II. AVERAGE EMPLOYEE COMPENSATION (in € thousand) Workforce in Germany 95 96 1% 99 3% 102 3% 107 5% III. MANAGING BOARD MEMBERS' COMPENSATION (in € thousand) Dr. Roland Busch 6, (since April 2011, President and CEO since Feb. 2021) 730 4,441 (34)% 6,008 35% 5,979 0% 6,815 14% Cedrik Neike (since April 2017) 2,331 2,017 (13)% 3,524 75% 4,215 20% 4,723 12% Matthias Rebellius (since Oct. 2020) – – – 3,435 – 3,160 (8)% 3,723 18% Prof. Dr. Ralf P. Thomas (since Sept. 2013) 6,740 4,087 (39)% 4,235 4% 4,304 2% 5,270 22% Judith Wiese (since Oct. 2020) – – – 4,185 – 3,223 (23)% 3,696 15% Former Managing Board members Lisa Davis (until Feb. 2020) 7,969 6,562 (18)% 1,434 (78)% 1,721 20% 1,671 (3)% Klaus Helmrich (until March 2021) 6,679 4,186 (37)% 2,756 (34)% 1,620 (41)% 1,670 3% Joe Kaeser (President and CEO until Feb. 2021) 12,978 8,051 (38)% 4,616 (43)% 3,238 (30)% 3,338 3% Janina Kugel (until Jan. 2020) 4,192 2,631 (37)% 1,274 (52)% 1,620 27% 1,670 3% Michael Sen (until March 2020) 2,448 1,991 (19)% 5,914 197% 1,620 (73)% 2,088 29% 1 Revenue as reported. In fiscal 2020, the segments “Gas and Power” and “Siemens Gamesa Renewable Energy” were classified as discontinued operations and are therefore not included in the amount reported for fiscal 2020. 2 The primary measure for managing and controlling revenue growth is comparable growth, because it shows the development in Siemens’ business net of currency translation effects arising from the external environment outside of Siemens’ control and the portfolio effects that involve business activities that are either new to or no longer a part of the relevant business. 3 Basic earnings per share from continuing and discontinued operations as reported. FISCAL 2023 35
 Siemens Report FY2023 Page 185 Page 187